


 16 / 36

CAMLOG&Science – Chapter 3
Fig. 11:
Box plot diagram of the quasistatic fracture strengths of the five tested implant systems:
Br = Brånemark, Fr = FRIALIT
®
-2, Re = Replace
®
Select, Ca = CAMLOG
®
, Sc = Screw-Vent
®
. dyn
= after chewing simulation using dynamic loading; contr = without dynamic loading (adapted
from Steinebrunner 2006).
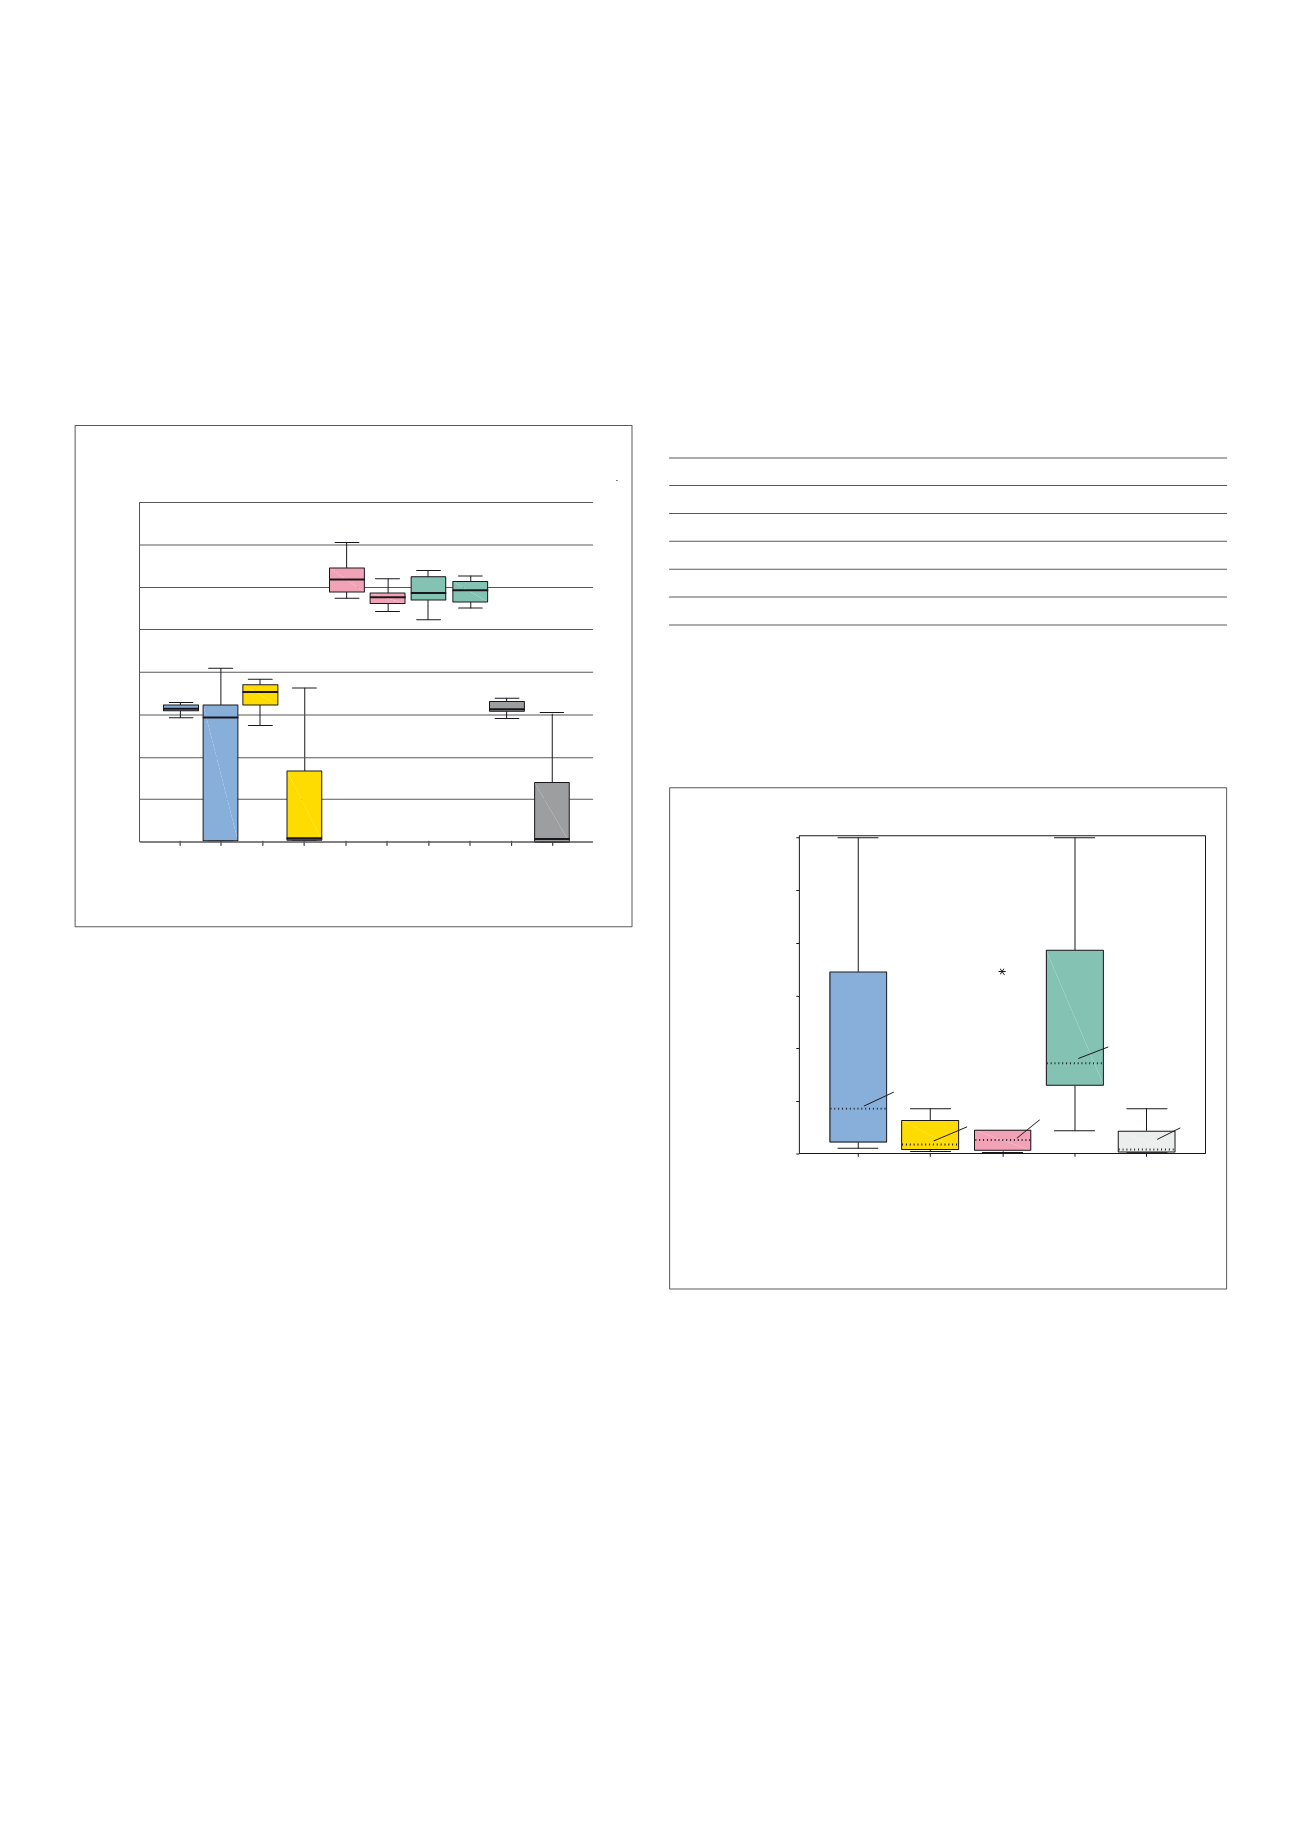
Fig. 12:
Box plot diagram showing the chewing cycles reached before microbial leakage occurred
in the individual systems. ... median value. * extreme value. The CAMLOG
®
Implant System clearly
reached the highest mean number of cycles among the tested systems (adapted from Steinebrunner
2006).
Using the same chewing simulation test set-up as illustrated in Figure 10A,
Steinebrunner et al. (2005a) also measured the seal of the implant-abutment
connections of five different implant systems, the Brånemark, FRIALIT
®
-2, the
Replace™ Select, CAMLOG
®
and the Screw-Vent
®
. They checked migration
of test microbes from the internal area of the implant-abutment connection
in a sterile external culture medium during cyclic loading. The CAMLOG
®
Implant System reached a significantly higher number of chewing cycles than
the FRIALIT
®
-2 and Screw-Vent
®
implant systems before microbial leakage
was noticed (Fig. 12).
Tab. 4:
Survival rates of eight implants from each group in the dynamic, alternating loading test.
The test was ended after 1.200.000 cycles (adapted from Steinebrunner et al., 2008).
SURVIVAL RATES
LOADING CYCLES FAILURE [N]
Replace-Select
1.200.000 ± 0
0
Camlog
1.200.000 ± 0
0
Branemark
954.300 ± 121.014
3
Compress
922.800 ± 102.242
3
Screw-Vent
913.200 ± 102.242
6
Frialit-2
627.300 ± 164.097
6
Sc
dynB
Sc
contrB
Ca
dynB
Ca
contrB
Re
dynB
Re
contrB
Fr
dynB
Fr
contrB
Br
dynB
Br
contrB
2000
1750
1500
1250
1000
750
500
250
0
Subgroups
Fracture loads (N)
**
*
**
24.300
6
7
6
7
6
N =
Screw Vent
Camlog
Replace
Select
Frialit-2
Brånemark
1.200.000
1.000.000
800.000
600.000
400.000
200.000
0
172.800
43.200
345.600
64.800
System
Chewing cycles